Author: Eleanor Richard
Mentors: Yuchen Han, David Hsieh
Editor: Patryk Kozlowski
Abstract
Cuprates are a class of materials that have generated interest for their strongly correlated degrees of freedom, including spin and charge. This strong correlation can yield exotic quantum phenomena, the most famous example being high-temperature superconductivity in quasi two-dimensional cuprates. We investigated the properties and dynamics of the quasi-1D cuprate Sr₂CuO₃ in the low energy (THz) regime to search for nonequilibrium phases. To access this energy scale, we employed time-resolved time-domain terahertz spectroscopy. We observed polarization dependence in the material’s equilibrium state in the form of four-fold symmetry with increased absorption diagonal to the Cu-O chain direction, which we attribute to the birefringence of the material. We photoexcited the material with a laser pulse and saw various relaxation dynamics that may be attributed to interesting quantum effects such as excitons. Due to their electronic properties, cuprates may have applications in information processing and storage. Better understanding the physics of cuprates will allow us to create more efficient and powerful devices.
Introduction
The presence of novel electronic phases is often manifested via their electrodynamic response to low photon energies (~1-200 meV), which is referred to as the terahertz (THz) regime. A class of materials called cuprates has been of particular interest in these experiments because these materials have strongly correlated degrees of freedom. Degrees of freedom in this context refer to the spin, charge, and orbital momentum of the electrons in the material. Depending on the values and the interactions between the degrees of freedom, the material exhibits different properties and quantum phenomena. In chemically doped cuprates, interesting phenomena such as antiferromagnetism and a strange metal phase have been observed [8]. These doped materials have some atoms in their original atomic structure replaced by atoms with a different number of valence electrons to introduce free charge carriers, such as electrons, in the material. The free charge carriers can then yield some of the aforementioned phenomena. However, light-induced phenomena, where the light generates the free carriers, had not yet been studied nearly as extensively.
We studied the 1D cuprate Sr₂CuO₃ to search for nonequilibrium, photo-induced phases. 1D cuprates are materials with the CuO₂ structure that is characteristic of cuprates but in one direction (Fig 1) [1]. The Cu-O chains along the b-axis are separated with Sr atoms in the other two directions. Therefore, the free electrons prefer to move, or ‘hop’, along the chain instead of hopping to different chains.

Before this experiment, Sr₂CuO₃ had not been studied in the THz regime though we believe that there is interesting physics due to prior experiments by the Hsieh lab in the THz regime [5].
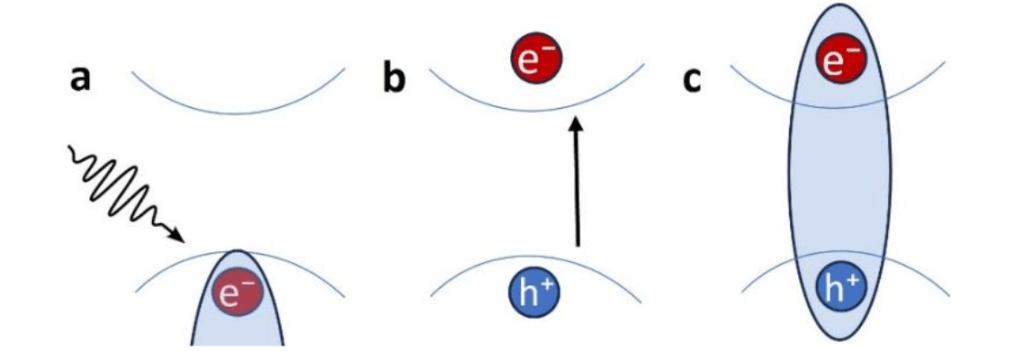
To access the low energy physics, we employed a technique called time-resolved time-domain THz spectroscopy. Studying the THz regime requires the use of a femtosecond (10⁻¹⁵ s) laser which sends pulses of 35 fs in duration every millisecond. The laser pulse photo-excites the material and resonantly interacts with the electron bands in the material to produce free electrons in a process called photo-doping (Fig 2).

Therefore, we can first photo-dope, or pump, the system with a laser pulse and then probe the system with another pulse at various time delays to measure how the material changes as a function of time due to the photo-doping [4].
Methods and Results
To look for photo-induced quantum phenomena, we first measured the terahertz response of Sr₂CuO₃ in static transmission, meaning that the material is not excited by an initial laser pulse i.e. without the photo-doping process shown in Fig. 2.
The terahertz light is generated through a nonlinear optical response of the original laser light with a ZnTe crystal in a process called optical rectification [4]. The terahertz light then passes through the sample, the Sr₂CuO₃ material in this case, before going through a second ZnTe crystal. The interaction between the terahertz light, a small portion of the original light, and the second ZnTe crystal provides information on any absorptions that occurred in Sr₂CuO₃ in the terahertz regime through what is known as electro-optic sampling [3]. These measurements are conducted to 1) explore the low energy properties intrinsic to the material and 2) distinguish the photo-induced effects from the material’s steady state for when we later photo-dope the material.

We measured our Sr₂CuO₃ samples in static transmission using a technique called Rotational Anisotropy Terahertz (RA-THz) spectroscopy. We placed the sample in a rotation mount and measured the THz transmission at different sample orientations. This rotation allowed us to study the light polarization dependence of energy absorptions in the sample. Light is a wave and hence can be polarized in various directions. This direction is significant because the axes of Sr₂CuO₃ have different properties, and, therefore, light’s interaction along various directions in the material yields unique effects. For example, the axes are parallel to different atomic bonds (Fig 1), which influence the axis’s response to light. By studying the material across many light polarizations as we do in RA-THz spectroscopy, we get a more comprehensive understanding of the symmetry properties of Sr₂CuO₃.
At the photodetector, we measured the signal as a function of time and light polarization to observe the material’s response to the terahertz light (Fig 4).

After the static transmission measurements, we conducted pump probe reflectivity terahertz spectroscopy to measure how Sr₂CuO₃ responds to photo-doping. In this configuration, we photo-excited the sample with an additional laser pulse, labeled as the pump in Fig 5b, and then studied the light reflected off the sample using the same technique as in static transmission. The two-beam setup from the static transmission of Fig 3 is labeled as Sampling in Fig 5b.

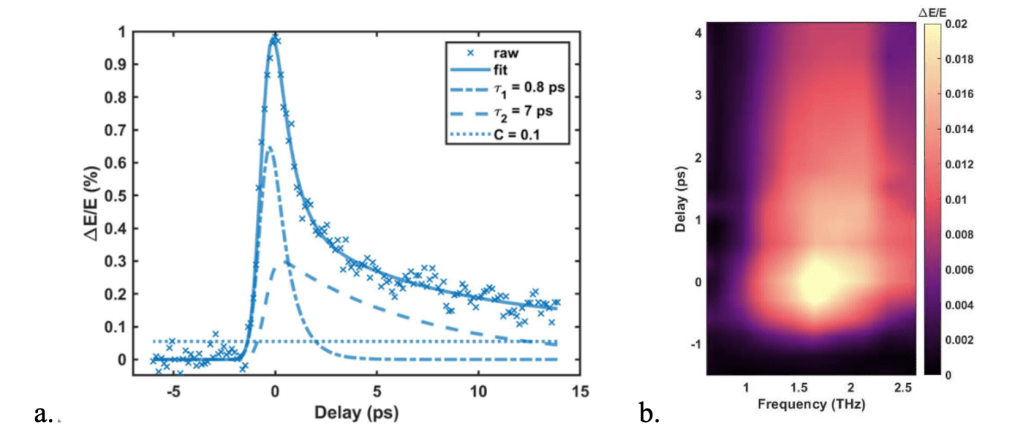
In this reflection setup, we took two kinds of measurements to study the response of Sr₂CuO₃ to the photo-doping from the pump pulse. First, we measured the change in electric field of the reflected light as a function of time (Fig 6a). Second, we measured the terahertz signal at fixed time delays between the pump and the probe (Fig 6b). This second type of scan is similar to the measurements we took in the static transmission case, yet we measured at various delays after the pump pulse to understand how the material’s dynamics change with time due to the photo-doping. The principal exponential fit in Fig 6a is a vertical slice of Fig 6b if Fig 6b were in the time domain rather than the frequency domain. As one notices, Fig. 6b shows a peak in ∆E/E at 0 ps with a quick decay ending before 1 ps and a slow exponential decay afterwards.
Discussion
We first looked at the results of the static transmission measurements as this data tells us about the properties of the material before we study what happens to the material when we photo-dope it with a pump pulse. We Fourier transformed the time domain pulses from the static transmission measurements shown in Fig 4 to analyze the data in the frequency space (Fig 7a). Dips in the frequency spectrum, as seen at 1.4 THz in Fig 7a, signify energy absorption from some process in the material at that frequency. The challenge then becomes determining what phenomenon caused the absorptions.
To our surprise, from our static transmission measurements of Sr₂CuO₃, we saw a four-fold angular symmetry in the frequency spectrum (Fig 7). This four-fold symmetry interestingly persisted throughout our frequency bandwidth. Additionally, in Fig 7a, at 1.4 THz, we saw a dip in the signal 45 degrees from the Cu-O chain direction, which can also be seen by the dip of the signal in Fig. 7b at intervals of 90 degrees starting at 45 degrees.

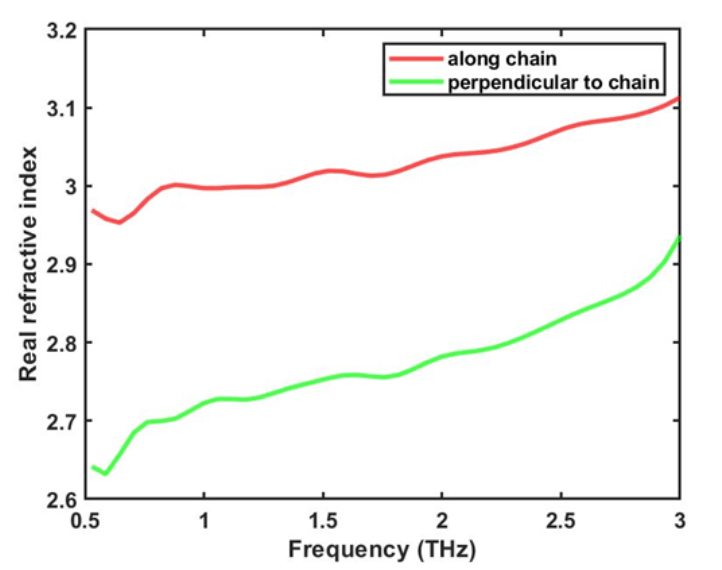
We attribute part of the four-fold symmetry to birefringence. Birefringence is when the light’s path through the sample is delayed more in one direction than in the perpendicular direction. Therefore, the refractive indices of the material, which are a measure of this delay, are different. Our calculations of the refractive index along the chain and perpendicular to the chain support this claim (Fig 8). We see that the refractive index along the Cu-O chain is in the 3-3.1 range whereas the refractive index perpendicular to the Cu-O chain is in the 2.65-2.9 range. Hence, light is more delayed in the Cu-O chain direction than in the perpendicular direction.
This birefringence, however, does not entirely explain the dip at 1.4 THz. To further understand this phenomenon, we plan to calculate the optical conductivity of the material at this frequency from the data we took to better understand the electronic behavior of the system. The optical conductivity is a measure of the electrical conductivity that is induced by an AC electric field, such as an ultrafast pulse of light [7]. In addition, we plan to ensure that the absorption is not simply an artifact of our terahertz spectroscopy set-up.
We used the reflectivity data to study the evolution of the material after the pump pulse to understand how the material responds to this photo-doping. After the pump pulse interacts with the material, the material relaxes, releasing the energy from the pulse over time and returning to its initial state. The time scale of this relaxation signifies what sort of response, and hence phenomenon, has occurred due to the laser pulse. We see in Fig 6a that the change in electric field decays very rapidly for a short amount of time and then much more slowly for the rest of the measurement. Therefore, we break down the total exponential decay into two exponentials, one with a fast decay time and the other with a slower decay time, 0.8 ps and 7 ps respectively. These two decay times are also portrayed in Fig 6b through the initial high rate of change in intensity of ∆E/E, followed by a slower decay.
The two decay times we observed signal that there may be two phenomena occurring in the material when energy is added to the system with the pump pulse. In some cases, the faster decay indicates an electronic response whereas the slower decay may be from the material cooling down after being heated from the pump pulse [4]. One theory for the first phenomenon is that we are seeing Coulombic excitons (Fig 9), that are quickly forming and then relaxing back to their unbound state (Fig 9a) after the pump pulse [6].
Further measurements are required to investigate the existence of Coulombic excitons in Sr₂CuO₃. We plan to conduct fluence dependence measurements, where we increase or decrease the power of the pump pulse. Higher fluence, and hence higher pump power, would yield more excitons because more electrons are excited into the conduction band [6]. Therefore, if photo-doping Sr₂CuO₃ indeed creates excitons, for higher fluence we would expect to see a greater ∆E/E in the measurements in Fig 6. In addition, we plan to cool down the sample to investigate whether we see additional absorptions and/or different time decays in the material. These low temperature measurements may be interesting because the optical conductivity of Sr₂CuO₃ increases at lower temperatures in the terahertz regime [7]. This increase in the optical conductivity means that more current is induced in the material due to the laser pulse, which could affect the response of the material and/or produce a stronger output signal.
Much of the phenomena we observed raises questions and requires more investigation. Nevertheless, the abundance of interesting physics in the terahertz regime is clear. Such experiments reveal the exciting aspects of strongly correlated systems.
Acknowledgements
Thank you to David Hsieh for the incredible opportunity to work in his lab this summer. Thank you to Yuchen Han for being a great mentor and teaching me so much. Thank you to the entire Hsieh lab group for being so welcoming. Thank you to the Sankar lab and Suganya Murali at Academia Sinica, Taiwan for the samples. Thank you to the WAVE program and the Institute for Quantum Information and Matter (IQIM) for making it possible for me to be at Caltech this summer.
References
- Fujisawa H., Yokoya T., Takahashi T. et al. “Angle-resolved photoemission study of Sr₂CuO₃”. Phys. Rev. B 59, 7358 (1999).
- Pala, N., Abbas, A.N. Terahertz Technology for Nano Applications. Encyclopedia of Nanotechnology. Springer, Dordrecht. (2012).
- Jens Neu, Charles A. Schmuttenmaer; Tutorial: An introduction to terahertz time domain spectroscopy (THz-TDS). J. Appl. Phys. 21 December 2018; 124 (23): 231101.
- Mehio, O., “Ultrafast dynamics of photo-doped Mott antiferromagnets”. California Institute of Technology (2023).
- Mehio, O., Li, X., Ning, H. et al. “A Hubbard exciton fluid in a photo-doped antiferromagnetic Mott insulator”. Nat. Phys. 19, 1876–1882 (2023).
- Kaindl, R., Carnahan, M., Hägele, D. et al. “Ultrafast terahertz probes of transient conducting and insulating phases in an electron–hole gas”. Nature 423, 734–738 (2003).
- Kim, K. W., Gu, G. D., Homes, C. C. et al. “Bound Excitons in Sr₂CuO₃”. Phys. Rev. Let. 101, 177404 (2008).
- Sarkar, T., Greene, R., Mandal, P., et al. “The Strange Metal State of the Electron-Doped Cuprate”. Annual Review of Condensed Matter Physics. Vol 11 (2020).
Further Reading
[1] An overview on cuprates and their high-temperature superconductivity can be found here.
[2] An introduction to terahertz spectroscopy and its wide-ranged applications is detailed in this article.
[3] A description of excitons in various crystals is found here.
[4] More information on optical rectification and electro-optic sampling is found in this article.
