Author: Luke Lamitina
Mentor: Dimitri Mawet
Editor: Adèle Bastürk
Abstract
Since the first detection of a planet beyond our solar system [1], exoplanetary study has become an emerging field of research due to its contribution towards the knowledge of our own planet as well as its significance towards the knowledge of whether life on other worlds is possible. Using coronagraph and wavefront control technology, researchers can now study exciting characteristics of exoplanets such as chemical composition, temperature, magnetic fields, and rotational dynamics. We outline the results of increasing contrast for direct imaging for more precise characterization of exoplanets at the Exoplanet Technology Laboratory at Caltech. The experiments conducted in the Exoplanet Technology (ET) Laboratory at Caltech develop precision optical techniques to improve high-contrast spectroscopy to directly observe exoplanets. Test runs of new optical setups and methods are conducted on the High Contrast Spectroscopy Testbed (HCST) testbed, located in the Cahill Center for Astronomy and Astrophysics. We develop an environmental monitoring system to measure fluctuations in temperature, humidity, and pressure on the optical testbed. Through our work on building an environmental monitoring system, we were able to find the optimal time for testing on the optical testbed, which led to a new record of 10-8 in achieved contrast. Further, we utilize the Vortex Imaging Pipeline (VIP) to analyze NIRC 2 data around an interesting candidate called MWC 758. Here, we were able to implement the VIP pipeline to confirm that the MWC 758 has a protoplanetary disk of gas containing three spiral arms all with local density fluctuations which sometimes give rise to false point source-looking regions.
Introduction
Within the past couple of decades, the dominant way of observing these extrasolar celestial bodies was through indirect methods such as the transit event method, astrometry method, and radial velocity method [2]. However, innovative technologies and techniques for probing these planets more comprehensively have arisen. One of these methods is direct imaging [3]. Direct imaging does, however, pose some new hurdles due to its precise nature. When trying to directly observe an exoplanet it is difficult to differentiate the planet’s light from the star light. Coronagraphs take advantage of the distinct quantum characteristics of light, giving them the ability to perform tasks such as canceling out only the starlight. Additionally, wavefront control, using a deformable mirror, helps to reduce aberrations in the light received from the observed system. In fact, the contrast ratio of starlight to planet light is approximately 10-10 for an Earth-like planet around a Sun-like star. Hence, the measurements taken require extremely stable conditions and clever post-processing techniques. Any imperfection in the optical path, induced by effects such as thermo-mechanical drifts at the telescope or instrument level (or the atmosphere for ground-based telescopes), results in a degradation of coronagraphic capability and destroys the planetary signal.
Due to the level of precision necessary to implement these methods, it is extremely important to understand the environment we are testing in. Having a way to monitor the temperature, humidity, and pressure of the testing environment allows researchers to understand noise in the data as well as the optimal conditions and times to conduct tests. These tests aim to develop new technologies that will be implemented in future space telescope missions to take data of distant planets.
The ET Lab is not just aiming to implement its technology for future missions; it is also currently conducting scientific research and detection of exoplanets from data taken using instruments such as NIRC 2 implemented at the Keck Observatory. One way to search for exoplanets using direct imaging is through post-processing techniques, such as principal component analysis, through the application of the Vortex Imaging Pipeline (VIP Pipeline).
Science Instrumentation Setup
To discuss the development of our adaptive optics system we first must understand the physical principles behind how coronagraphs and deformable mirrors operate. When trying to directly observe a planet we notice that it is easily drowned out by the diffracted and scattered light coming from its host star. We observe that for Jupiter-like planets around Sun-like stars, the planet’s light is on the factor of 109 times dimmer than its host star. To solve this problem, we want to block out as much of the starlight as possible while keeping the light coming from the planet. One instrument we use to do this is called a coronagraph. Originally, coronagraphs were meant to observe the solar corona. However, researchers realized that they could also block out a star’s light to see the surrounding exoplanets. Coronagraphs usually have two components: a coronagraphic mask and a Lyot stop. The coronagraphic mask takes the central starlight and redirects it to the outer edges of the light beam. Then, a Lyot stop is placed in the beam to block the light from the edges. This results in a final beam of light without any light coming from the star [Fig 1]. This works because when the light from a star and a planet is coming into a telescope centered on the host star, the light from the planet is slightly off angle [Fig 2]. This means that the planet light will miss the center of the coronagraphic mask preserving its existence in our final data.


The second important feature of the adaptive optics system is the deformable mirror. When light enters a telescope, its wavefront has slight fluctuations caused by various atmospheric and instrumentation inconsistencies. For our coronagraphic mask to be effective, the beam must be perfectly aligned and cleaned of these fluctuations seen from frame to frame. A deformable mirror is a small mirror that has thousands of actuators behind its reflective surface. This way we can shape the mirror in real time to reshape the beam of light canceling out the fluctuations seen in its wavefront [Fig 3]. When combined, the use of a deformable mirror with a well-designed coronagraphic mask gives us the ability to directly observe exoplanets that are vastly dimmer than the stars that they are orbiting around.

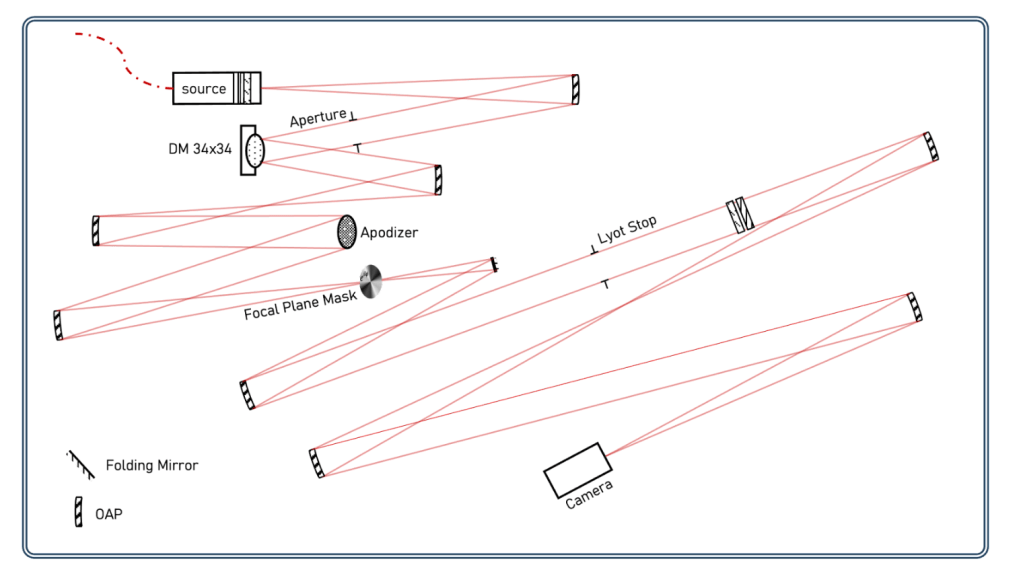
To accurately characterize and observe exoplanets directly, we are working on improving the performance of our adaptive optics system through new designs for the coronagraphic masks and improved algorithms for the deformable mirror. As we approach higher contrast levels, we can observe fainter, less massive bodies and objects closer in orbit to their host stars. This is vital in the search for habitable worlds because terrestrial planets have closer orbits as well as smaller planetary radii. To improve this technology, we use the High Contrast Spectroscopy Testbed (HCST). On the testbed, a laser emits a point source as a fake star, and we can do measurements and test different adjustments to the instruments [Fig 4]. However, in the lab, there are many factors to consider with such a precise measurement. There can be particulates in the air, temperature fluctuations, and light scattering caused by humidity. These factors can affect the results very drastically since we are using a high-precision laser beam. Any particulates, from humidity or otherwise, can cause tiny splits in this beam resulting in stray lightpaths within the bed that can cause “ghosts” or false light sources in the data. Additionally, temperature fluctuation can affect the thermo-mechanical properties of the optical train. We see that they can warp the bench and the optics.

Methods
High Contrast Spectroscopy Testbed
Optical and instrumentation experiments were done using the climate-controlled High Contrast Spectroscopy Testbed (HCST) [Fig 11]. Here, we test the functionality of our deformable mirror as well as some of the coronagraphic masks mentioned above.
Principal Component Analysis and VIP
For our post-processing techniques, we used the Vortex Imaging Pipeline and data taken from the Keck Observatory. The results presented in this paper are primarily implementing the principal component analysis functions of this pipeline, however, there are also various other available techniques such as non-negative matrix factorization (NNMF) and local low-rank plus sparse plus gaussian-noise decomposition (LLSG)[5].
Results
It is important to monitor the environment within our testbed, which is sealed during experiments, to better understand fluctuations in our data during runs as well as which data presents accurate readings on the true performance of our equipment. To do this we wired three BME 680 sensors to Wi-Fi modules and placed them in the testbed to take regular environmental readings. The data is sent to a web application called Ubidots which stores it and can be accessed at any time [Fig 5].

This was vital in better understanding what times the lab environment is most stable and when it is the best time to run our experiments. Additionally, we noticed that traffic within the lab throughout the day caused large fluctuations in temperature which caused us to designate specific days for testing when nobody entered the lab. Due to this, we saw vast improvements in our performance and recently achieved a new contrast record of 10-8. [Fig 6].

When discussing our post-processing techniques and results, it is important to outline our data structure. The data analyzed in this paper is taken from the science instrument called NIRC 2 implemented at the Keck Observatory. The data that we take is in the format of 3-dimensional data cubes. The cube analyzed in this paper had around 200 frames in it. To work with this data, we use a pipeline called the Vortex Imaging Pipeline (VIP) [5]. This pipeline is made specifically for our form of data and has functions in it that allow us to perform processes like principal component analysis.
Principal component analysis is one of the main post-processing techniques used when directly observing exoplanets. Ultimately, when trying to observe an object we must reduce all stray light and structures seen in our data that are not the object. These can be due to noise from instruments or structures inherent to the system we are looking at like spiral disks of gas. What principal component analysis does is compare every frame of our cube to every other frame and look to find the most common components between them. It then numbers each component based on its commonality throughout the dataset. Lastly, when running our pipeline, we specify how many principal components we want to remove. This is vital because if we do not remove enough principal components, we just see noise, but if we remove too many, we do not see the planet [Fig 7]. Finding the optimal amount of components usually comes down to trying a range of components and comparing their signal to noise.

Using principal component analysis and the VIP pipeline allowed us to gain insight into a system called MWC 758. This candidate was previously observed in 2018 and deemed to not have any exoplanets [7]. However, we did notice two distinct spiral arms due to a protoplanetary disk around the star as well as an intriguing candidate about 10-15 AU south of the star. Interestingly, it was recently observed that there might be an exoplanet with an orbit of ~100 AU [Fig 8] [6]. Using an updated version of the VIP pipeline, we tried to see if updated processing techniques would bring out this supposed point source hidden in the southeast sector of our images. However, we found no such point source [Fig 9]. Additionally, we found that the point source we observed to be 10-15 AU from the star was a local region of density in a third spiral arm [Fig 10].


Using the VIP pipeline, we were better able to understand the seeming point source object in our original data as well as give a strong counterargument for the existence of the exoplanet as presented by Wagner et al. To fully understand this system, more data and research is needed. From our findings, we conclude that MWC 758 is a system with a protoplanetary disk of gas containing three spiral arms all with local density fluctuations which sometimes give rise to false point source-looking regions. Further investigation into the dynamics of MWC 758 and similar protoplanetary systems is vital in our understanding of the evolution of solar systems and circumstellar disks.
Acknowledgements
Thank you to Professor Dimitri Mawet, Jorge Llop-Sayson, Arielle Bertrou-Cantou, Katelyn Horstman, Niyati Desai, and the entirety of the ET Lab for mentorship and guidance during my fellowship.
Thank you to Dr. Gary Stupian for funding this project through the Caltech SURF Program.
References
- Mayor, Michel, and Didier Queloz. “A Jupiter-mass companion to a solar-type star.” Nature, vol. 378, no. 6555, Nov. 1995, pp. 355–359, https://doi.org/10.1038/378355a0.
- Five Methods of Exoplanet Detection, iopscience.iop.org/article/10.1088/1742-6596/2012/1/012135/pdf.
- Fischer, D. A., et al. “Exoplanet detection techniques.” Protostars and Planets VI, 2014, https://doi.org/10.2458/azu_uapress_9780816531240-ch031.
- HCST | Exoplanet Technology Laboratory, etlab.caltech.edu/et-lab-facilities/hcst.
- Vortex-Exoplanet. “Vortex-Exoplanet/VIP: VIP Is a Python Package/Library for Angular, Reference Star and Spectral Differential Imaging for Exoplanet/Disk Detection through High-Contrast Imaging.” GitHub, github.com/vortex-exoplanet/VIP.
- Wagner, Kevin, et al. “Direct images and spectroscopy of a giant protoplanet driving spiral arms in MWC 758.” Nature Astronomy, vol. 7, no. 10, 6 July 2023, pp. 1208–1217, https://doi.org/10.1038/s41550-023-02028-3.
- Reggiani, M., et al. “Discovery of a point-like source and a third spiral arm in the transition disk around the Herbig Ae star MWC 758.” Astronomy & Astrophysics, vol. 611, Mar. 2018, https://doi.org/10.1051/0004-6361/201732016.
